- Case Study -
LAKE Pajamas
Ecommerce Marketing
- Case Study -
LAKE Pajamas Social Strategy and Management

The Challenge
LAKE Pajamas is an e-commerce retailer specializing in sleepwear and loungewear. With few brick-and-mortar locations, their primary sales channel is e-commerce.
LAKE approached us to enhance their digital marketing–specifically their social media marketing on Facebook and Instagram.
Our Solution
Our work focused on three core business objectives: grow net new customers, grow and engage LAKE's social media community, and increase customer loyalty.
We achieved these goals through a data-focused approach that identified who our top-performing customers were and established campaigns that targeted similar customer profiles.
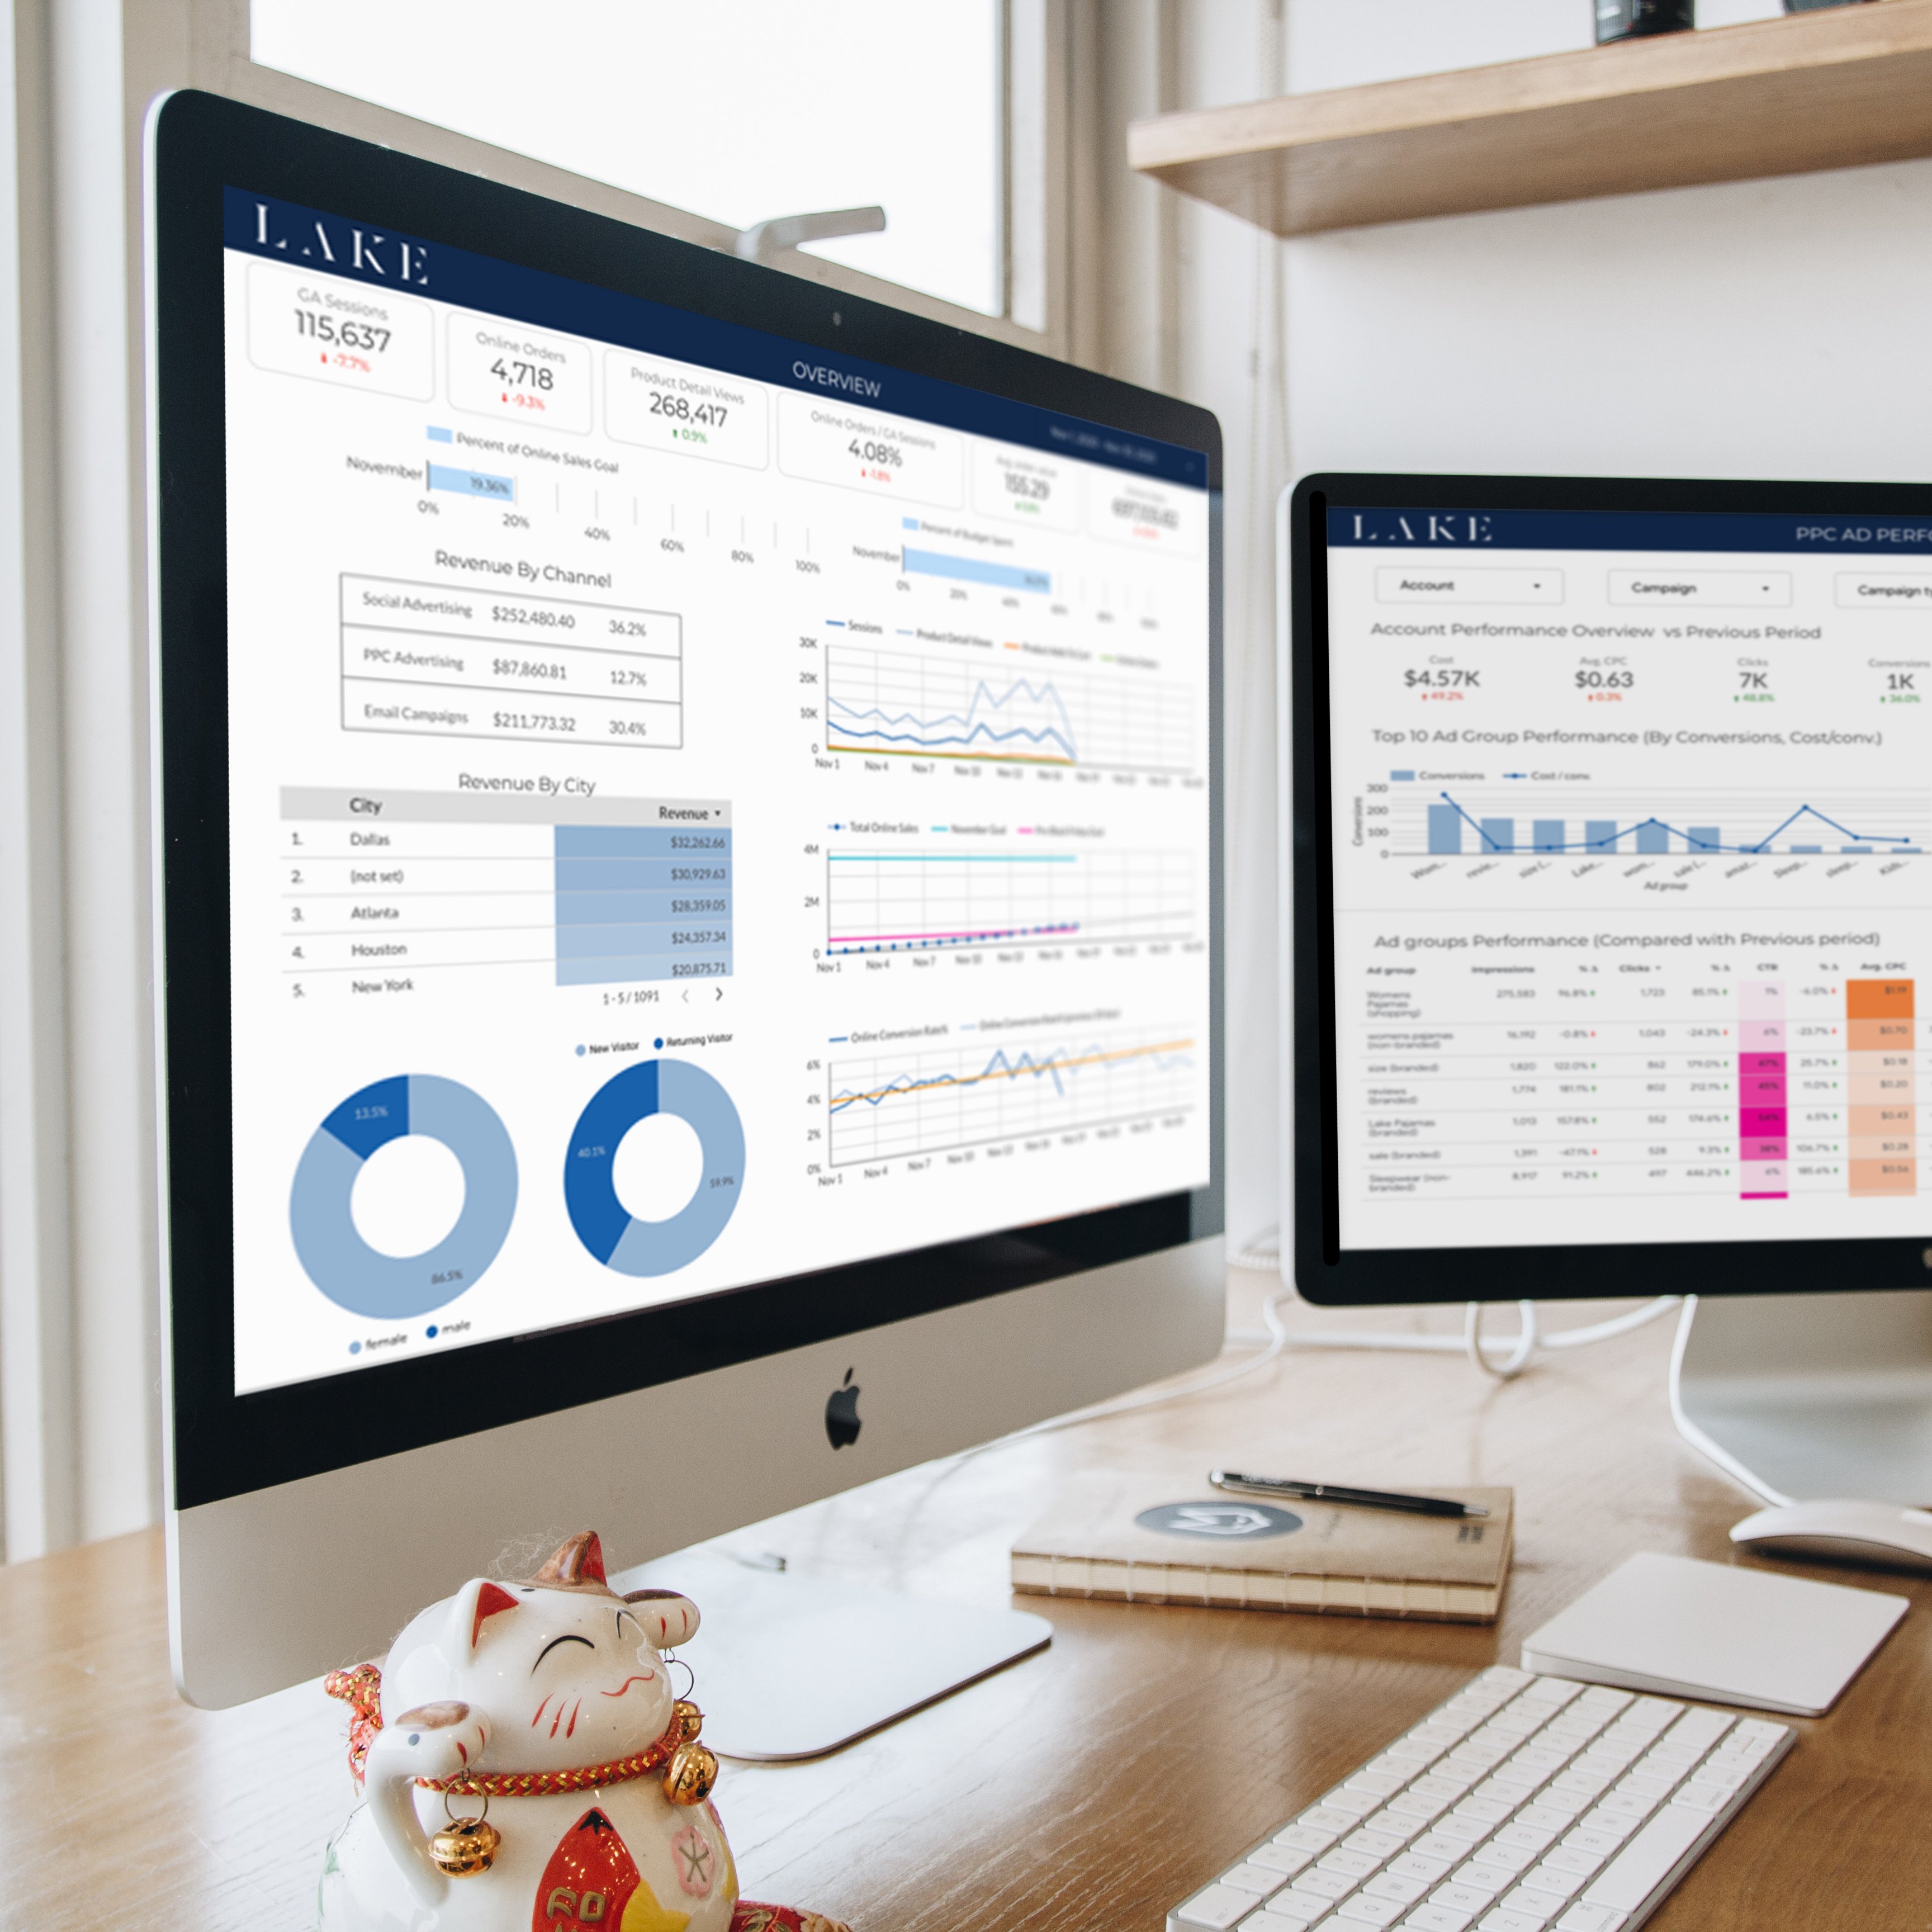
Campaigns were closely monitored and optimized through a real-time dashboard that tracked site analytics, sales, and key campaign metrics such as reach and frequency, cost per purchase, and return on ad spend (ROAS).
Seasonal Campaigns
While LAKE runs marketing campaigns year-round, key seasonal events are highly relevant to the brand and create an opportunity to reach a new audience. An example of one of these events is Mother's Day.
Our campaign celebrated Mom's wisdom—her sixth sense for knowing what's best and what truly matters. Our ads proposed that giving LAKE was the ultimate appreciation of everything she taught you, and she was sure to be proud that you were paying attention after all.
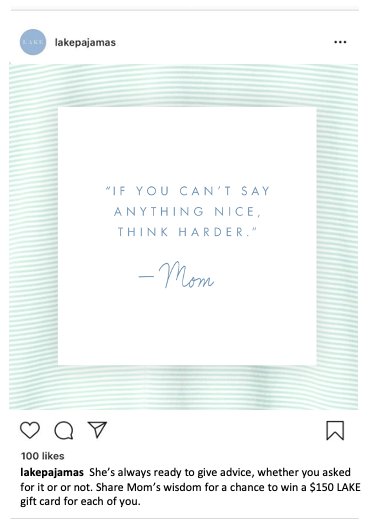
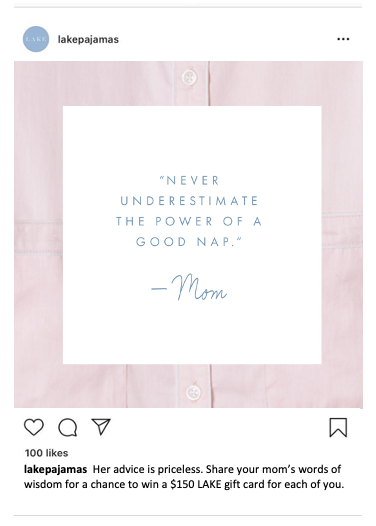
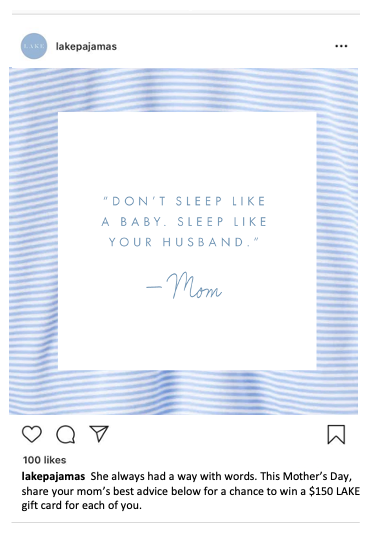
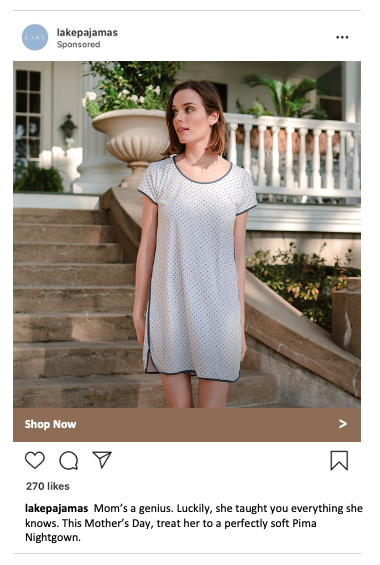
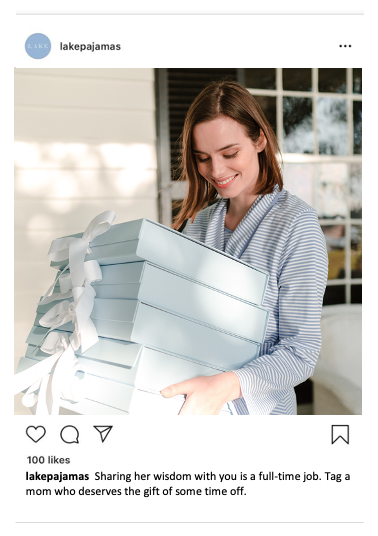
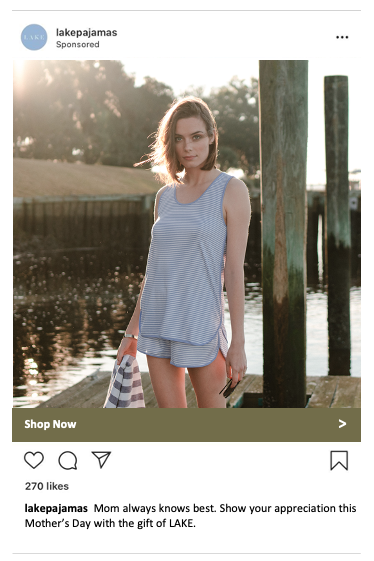
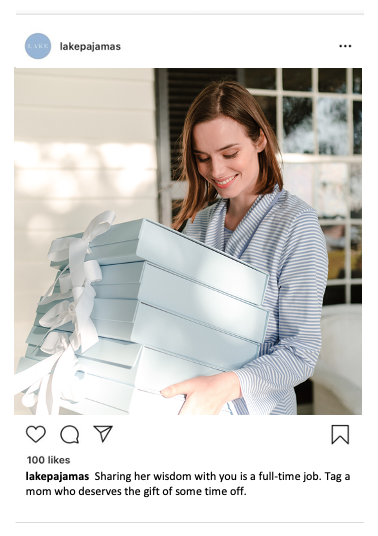
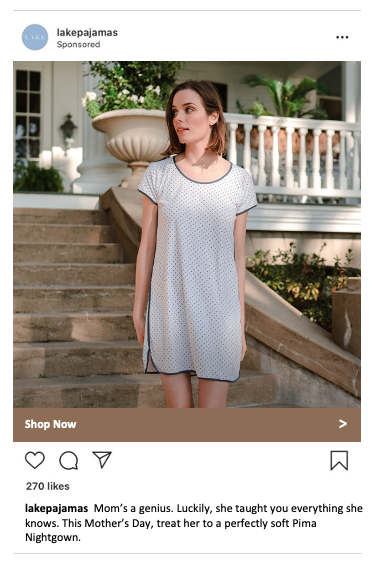
Instagram and Facebook Ads and Posts
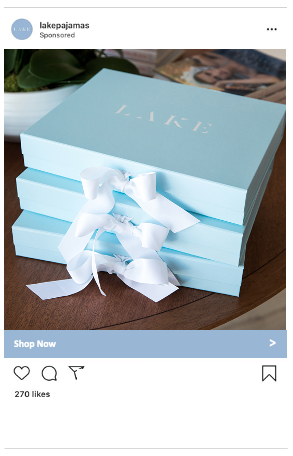
Our social ads and posts featured lifestyle photography, including some that highlighted LAKE's decorative gift boxes, paired with captions that celebrated Mom's wisdom.
The social campaign, which ran from 4/22 – 5/10, generated the most Mother's Day sales in LAKE's history and contributed to a return on ad spend (ROAS) of 26.38x for April and 34.39x for May.
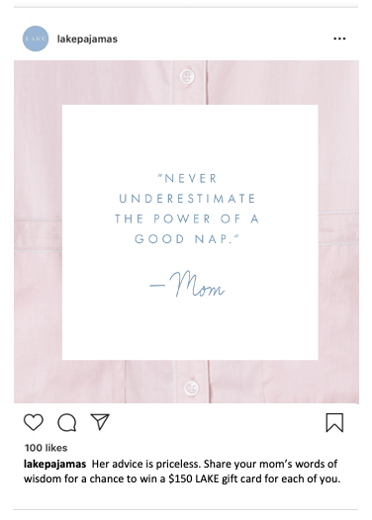
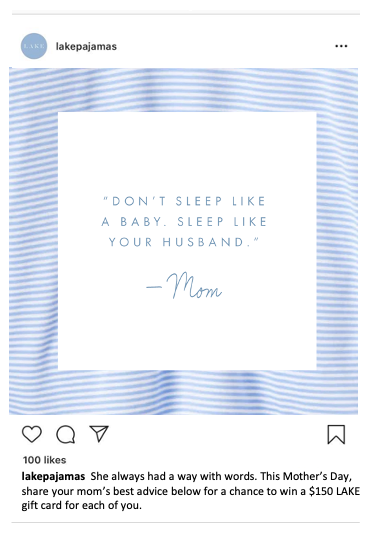
Emails
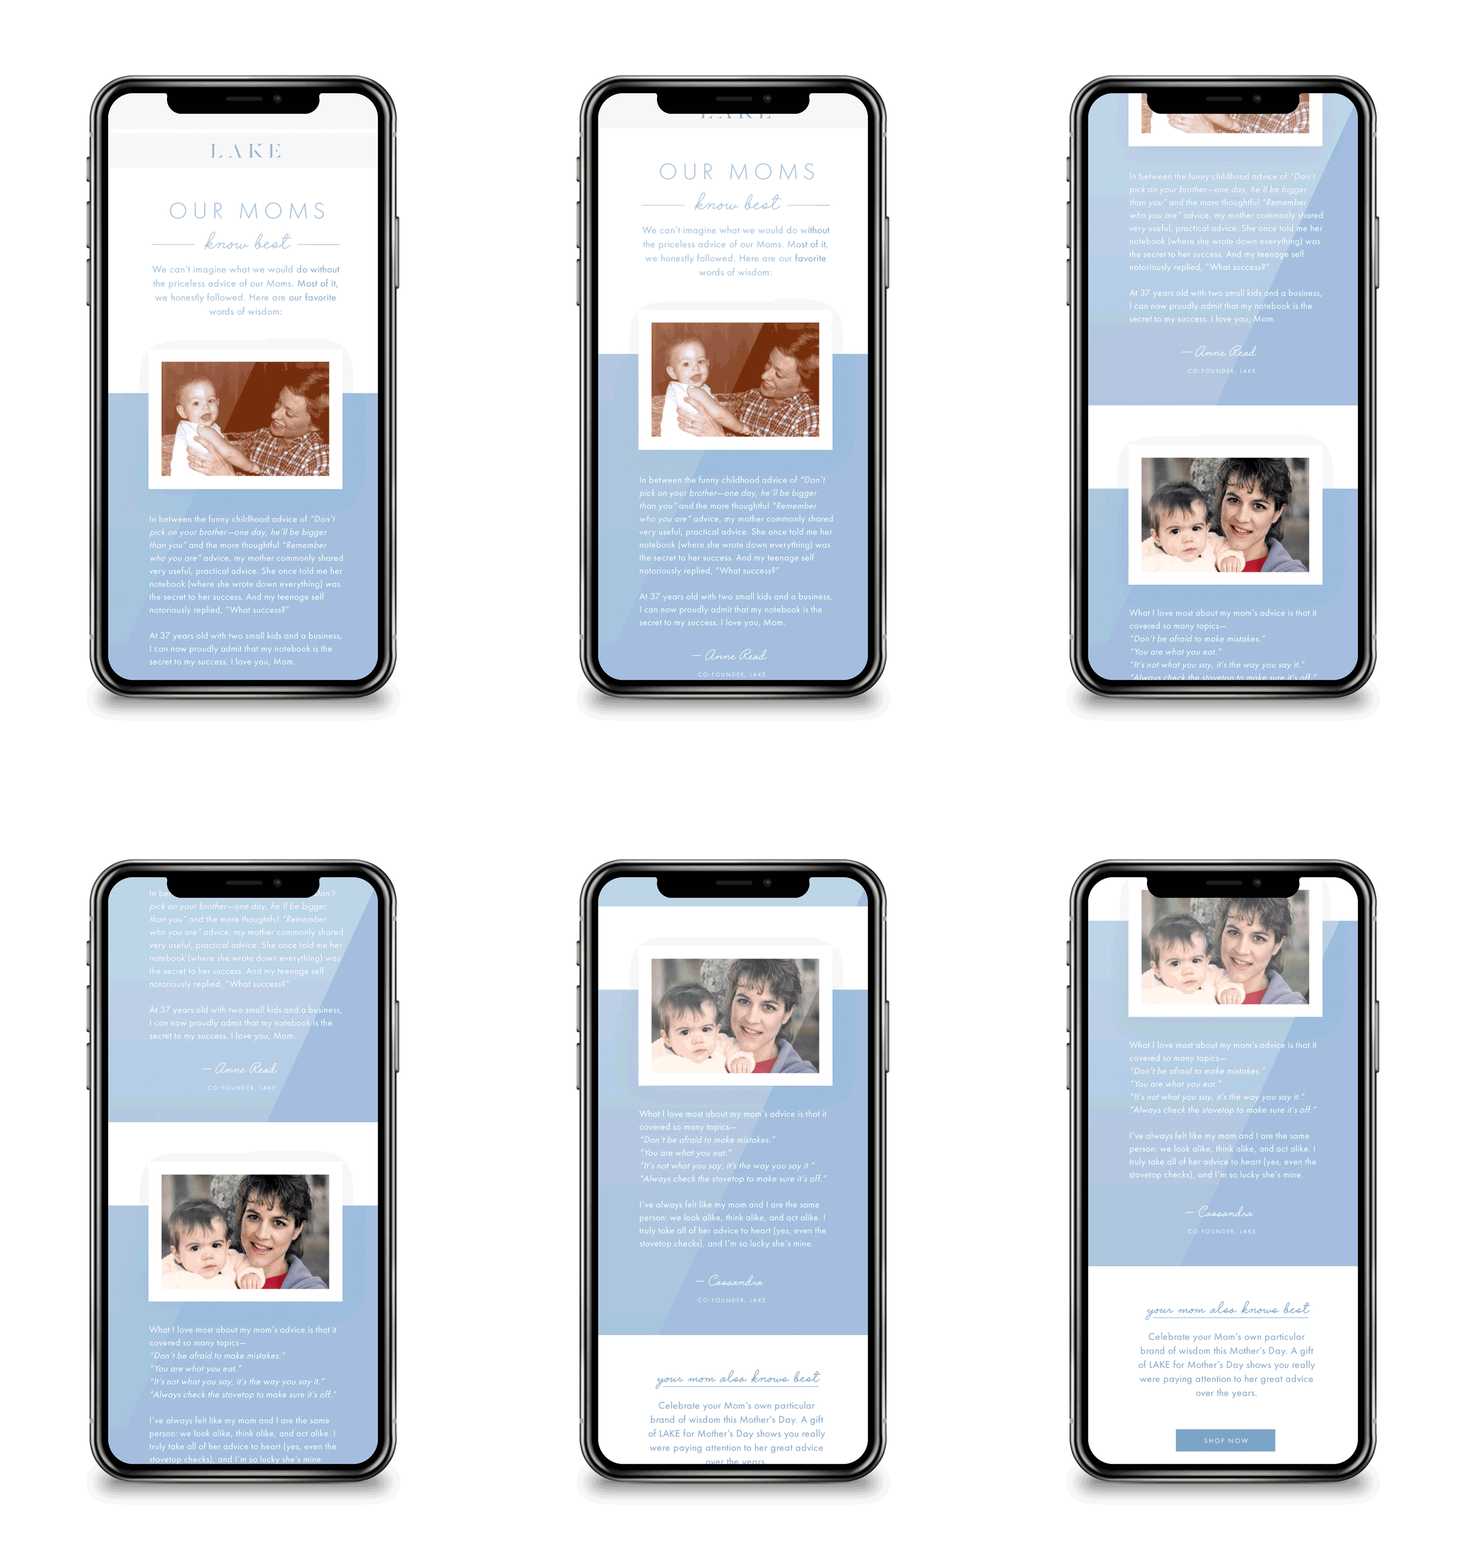
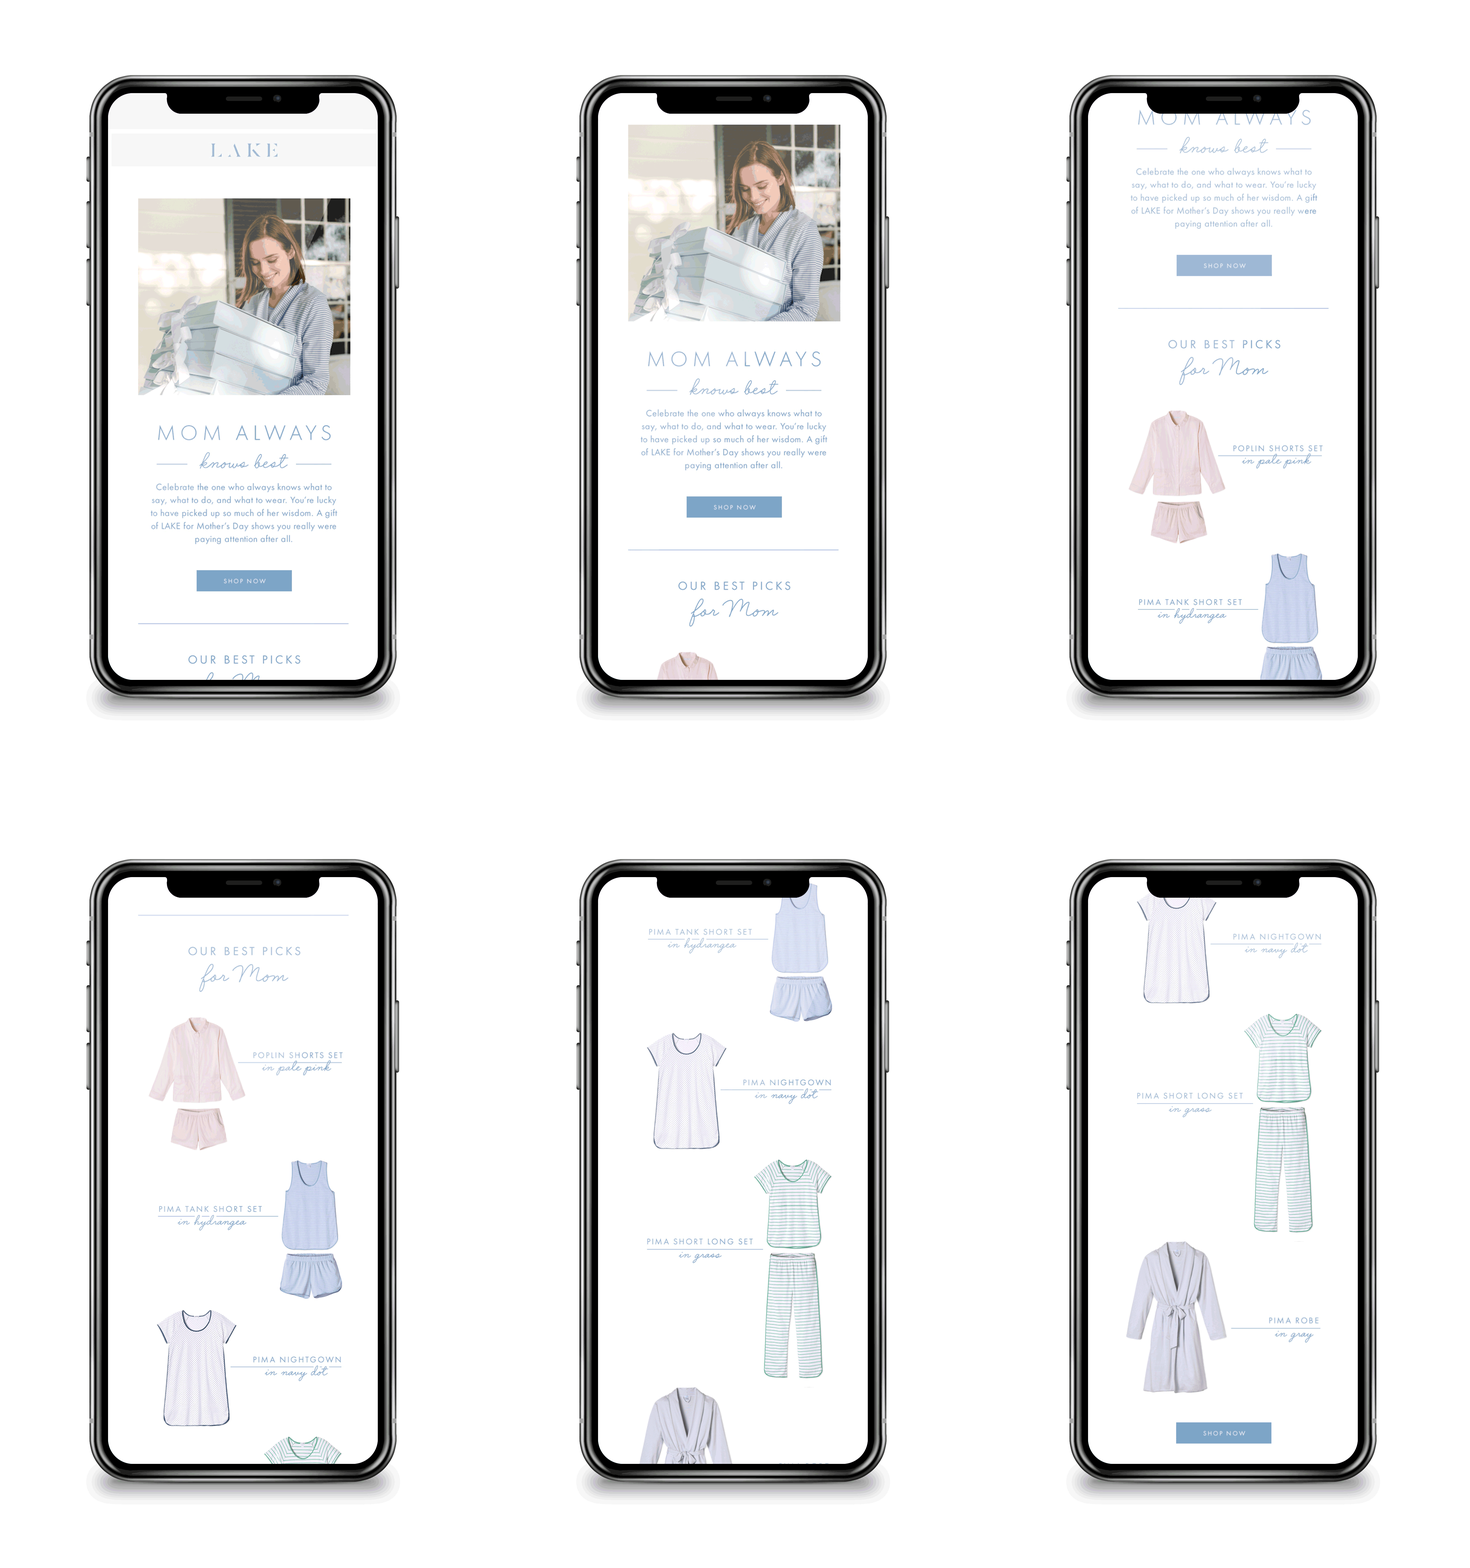
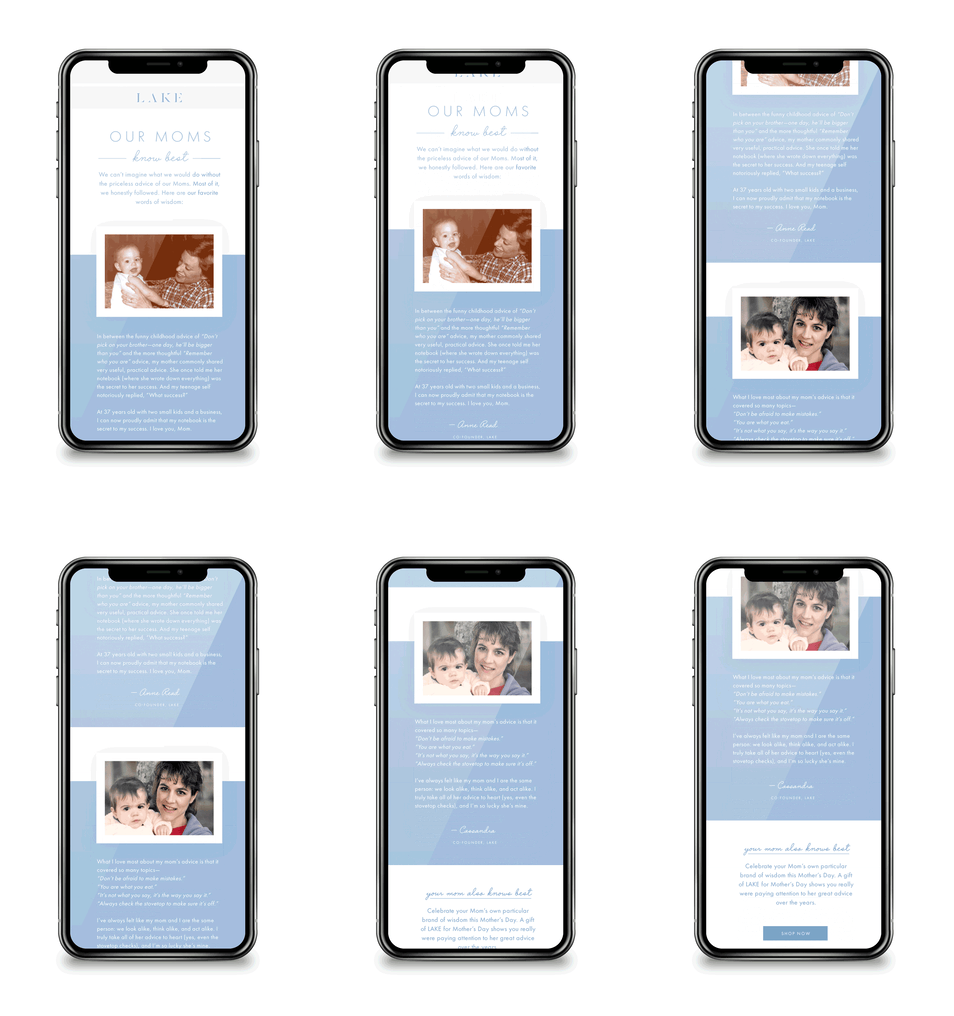
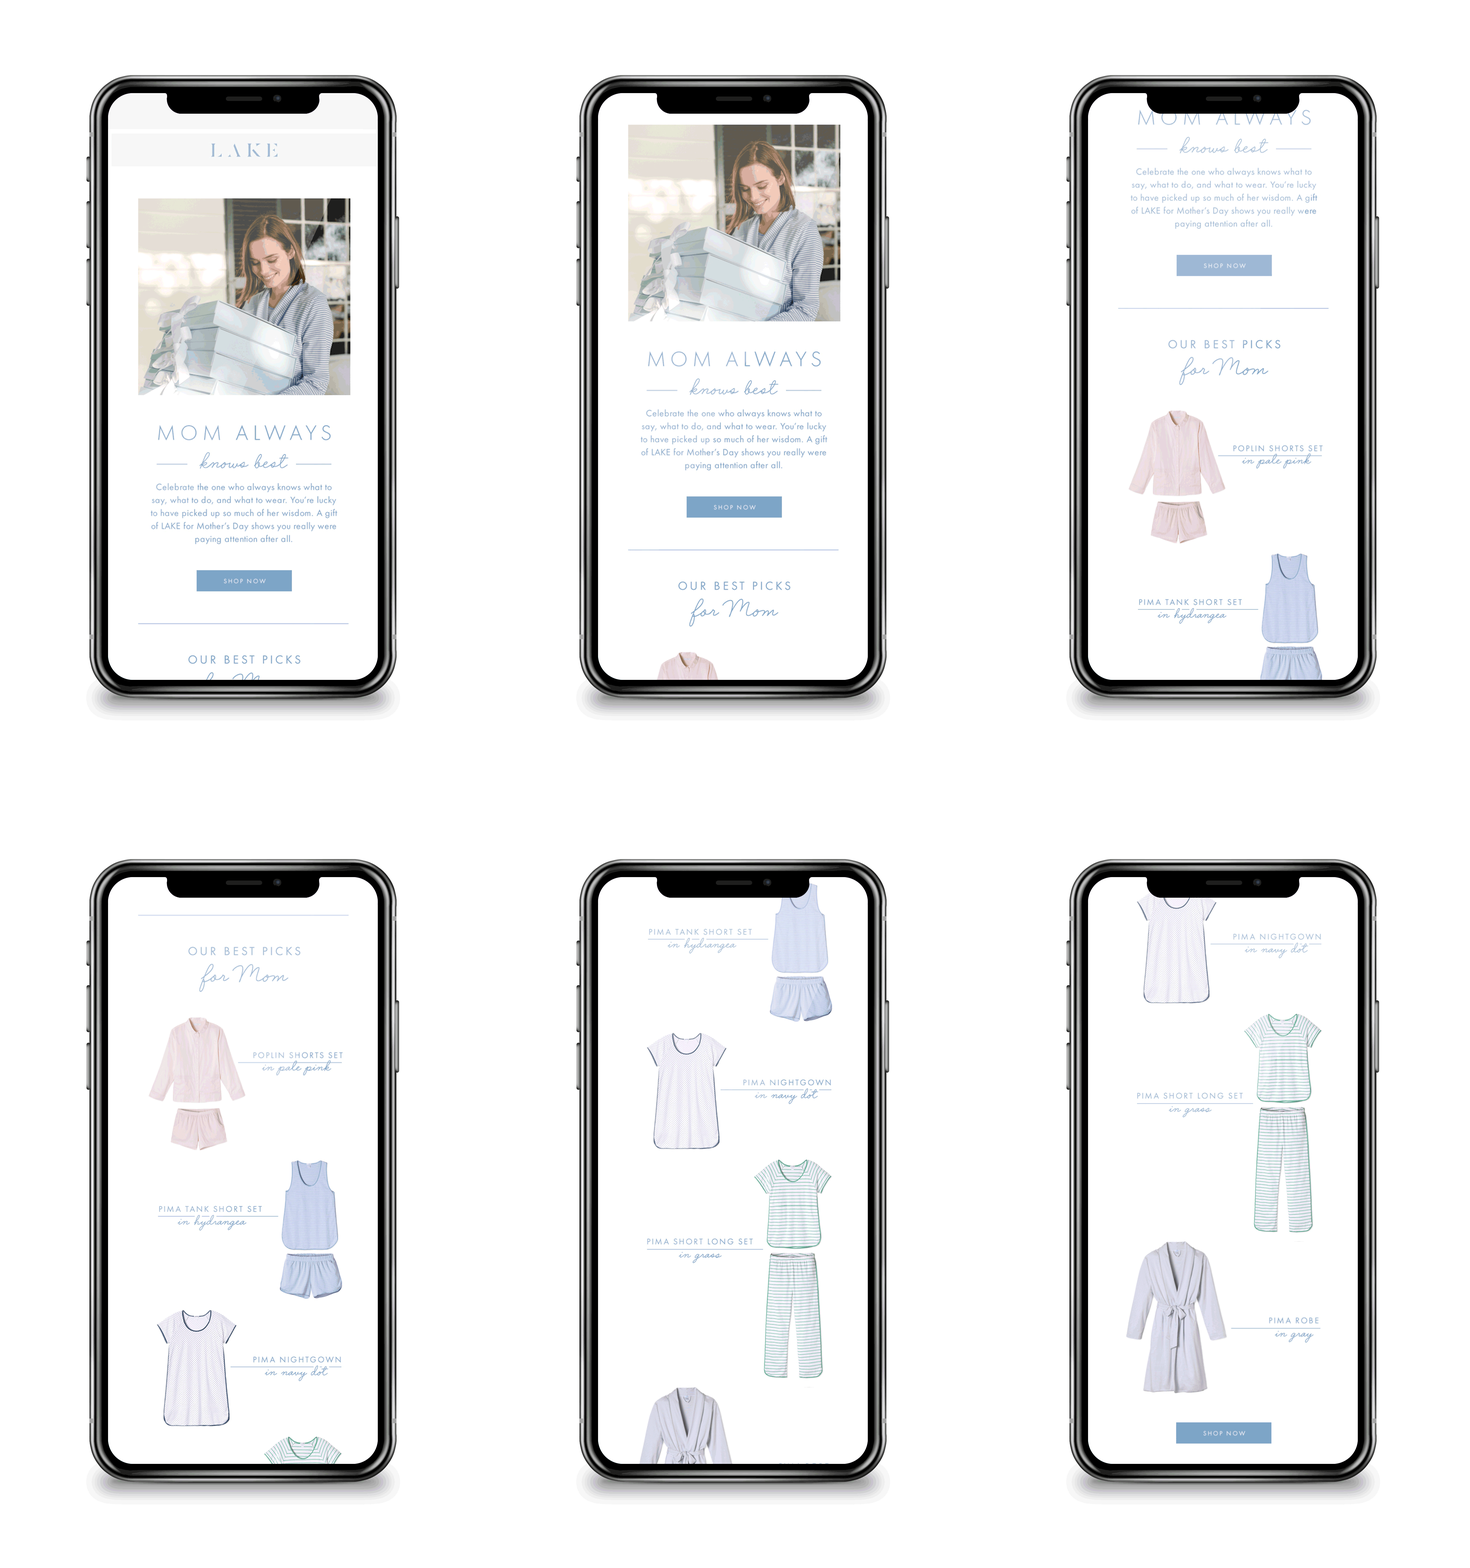
We designed two Mother's Day emails: a brand-focused email at the start of the campaign, which featured the owners' sentimental stories about their own Moms' wisdom (25.39% open rate, 0.27% conversion rate), and a more straightforward product-focused email a few days before the campaign end (25.75% open rate, 0.64% conversion rate).
Instagram and Facebook Stories
Our Mother's Day story ads leveraged engaging lifestyle images and videos with overlaid type treatment.
We utilized interactive elements such as polls, where appropriate, to encourage engagement, which extended our reach and lowered our cost per purchase.
Instagram and Facebook Stories
Our Mother's Day Story Ads featured an interactive poll, as well a video story with overlaid type treatment.

Story Ads
Our data showed that story ads were an effective channel, so we regularly updated ad creative to feature a combination of videos, lifestyle, and product photography.
Carousels
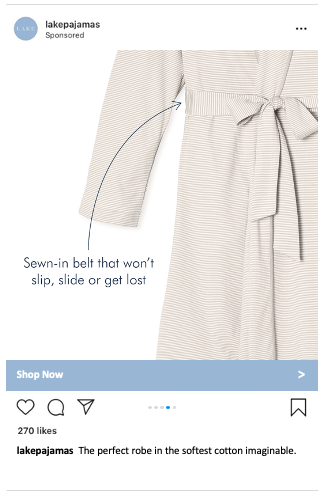
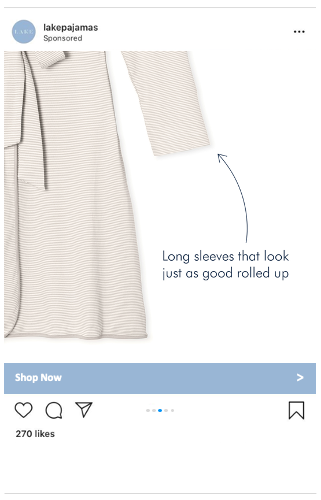
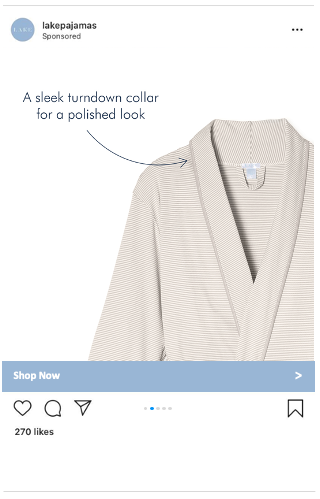
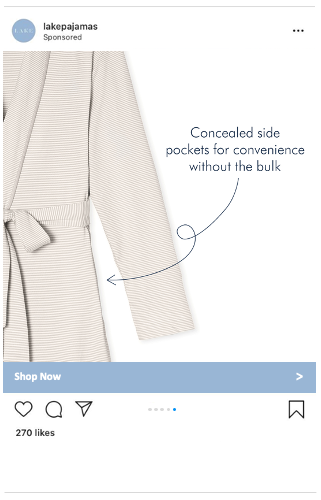
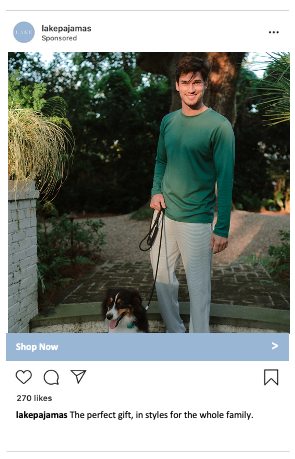
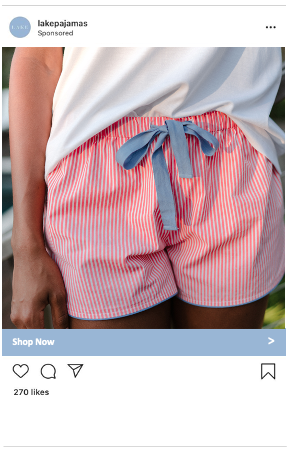
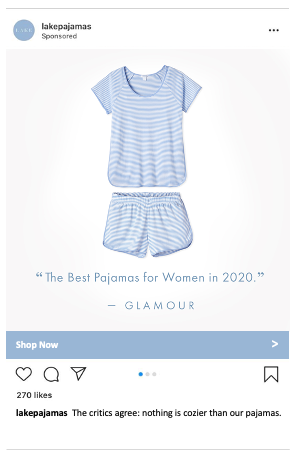
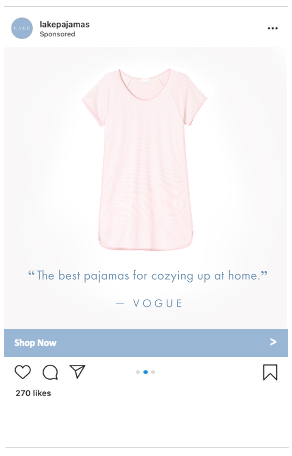
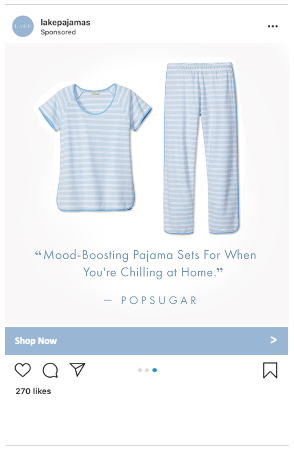
We tested various carousel types to find and optimize the best performing combinations. These tests included flat imagery, lifestyle imagery, feature callouts, press quotes, mixed media, and dynamic 7-10 frame carousel combinations.
Analytics Dashboards
In addition to monthly reporting discussions, we leveraged Google Data Studio to establish and maintain real-time dashboards to track KPIs across each marketing channel.
These dashboards ensured that our clients had access to up-to-date numbers in one location in an easy to read format.
The Results
Our campaign ended with LAKE having the best year in their history, achieving their highest online sales, total purchases, and average order value.
We drove new customers to the site (106% increase in site visits vs. our goal of +15% at the start of the year) and dramatically increased LAKE's social following.

0%
Increase In Sales YoY
0%
First-Time Orders Increase YoY
0%
Increase in Site Visits (Goal was 15%)
0%
Combined Social Following Increase